
CentOS 6.3_Nagios配置笔记
一.Nagios监控主机配置(IP:192.168.7.249)
1、安装nrpe服务
解压缩
[root@nagios ~]# tar -zxvf nrpe-2.14.tar.gz
[root@nagios ~]# cd nrpe-2.14
编译
[[root@nagios nrpe-2.14]#./configure
root@nagios nrpe-2.14]# make all
[root@nagios nrpe-2.14]# make install-plugin
只运行这一步就行了,因为只需要check_nrpe插件
2、编辑commands.cfg文件定义nrpe对的使用
[root@nagios ~]# vim /usr/local/nagios/etc/objects/commands.cfg
在最后面增加如下内容:
# 'check_nrpe ' command definition
define command{
command_name check_nrpe
command_line $USER1$/check_nrpe -H $HOSTADDRESS$ -c $ARG1$
}
说明:
command_name check_nrpe
定义命令名称为check_nrpe,在services.cfg中要使用这个名称.
command_line $USER1$/check_nrpe -H $HOSTADDRESS$ -c $ARG1$
这是定义实际运行的插件程序.这个命令行的书写要完全按照check_nrpe这个命令的用法.不知道用法的就用check_nrpe –h查看
-c后面带的$ARG1$参数是传给nrpe daemon执行的检测命令,之前说过了它必须是nrpe.cfg中所定义的那5条命令中的其中一条.在services.cfg中使用check_nrpe的时候要用!带上这个参数
3、配置监控对象(工作站及其服务等)
[root@nagios ~]# vim /usr/local/nagios/etc/nagios.cfg
在cfg_file=/usr/local/nagios/etc/objects/localhost.cfg下添加:
cfg_file=/usr/local/nagios/etc/objects/services.cfg
4、新建linux.cfg设置要监控的内容(address表示被监控的客户端IP)
[root@nagios ~]# vim /usr/local/nagios/etc/object/services.cfg
#定义被监控端名称和地址
define host{
use linux-server
host_name server1
alias server1
address 192.168.7.93
}
#定义被监控端服务
define service{
host_name server1
service_description check_ping
check_command check_nrpe!check_ping
max_check_attempts 5
normal_check_interval 3
retry_check_interval 2
check_period 24x7
notification_interval 10
notification_period 24x7
notification_options w,u,c,r
}
define service{
host_name server1
service_description check_users
check_command check_nrpe!check_users
max_check_attempts 5
normal_check_interval 3
retry_check_interval 2
check_period 24x7
notification_interval 10
notification_period 24x7
notification_options w,u,c,r
}
define service{
host_name server1
service_description check_load
check_command check_nrpe!check_load
max_check_attempts 5
normal_check_interval 3
retry_check_interval 2
check_period 24x7
notification_interval 10
notification_period 24x7
notification_options w,u,c,r
}
define service{
host_name server1
service_description check_disk_sda3
check_command check_nrpe!check_disk_sda3
max_check_attempts 5
normal_check_interval 3
retry_check_interval 2
check_period 24x7
notification_interval 10
notification_period 24x7
notification_options w,u,c,r
}
define service{
host_name server1
service_description check_zombie_procs
check_command check_nrpe!check_zombie_procs
max_check_attempts 5
normal_check_interval 3
retry_check_interval 2
check_period 24x7
notification_interval 10
notification_period 24x7
notification_options w,u,c,r
}
define service{
host_name server1
service_description check_total_procs
check_command check_nrpe!check_total_procs
max_check_attempts 5
normal_check_interval 3
retry_check_interval 2
check_period 24x7
notification_interval 10
notification_period 24x7
notification_options w,u,c,r
}
define service{
host_name server1
service_description check_swap
check_command check_nrpe!check_swap
max_check_attempts 5
normal_check_interval 3
retry_check_interval 2
check_period 24x7
notification_interval 10
notification_period 24x7
notification_options w,u,c,r
}
define service{
host_name server1
service_description check_http
check_command check_nrpe!check_http
max_check_attempts 5
normal_check_interval 3
retry_check_interval 2
check_period 24x7
notification_interval 10
notification_period 24x7
notification_options w,u,c,r
}
define service{
host_name server1
service_description check_ssh
check_command check_nrpe!check_ssh
max_check_attempts 5
normal_check_interval 3
retry_check_interval 2
check_period 24x7
notification_interval 10
notification_period 24x7
notification_options w,u,c,r
}
define service{
host_name server1
service_description check_mysql
check_command check_nrpe!check_mysql
max_check_attempts 5
normal_check_interval 3
retry_check_interval 2
check_period 24x7
notification_interval 10
notification_period 24x7
notification_options w,u,c,r
}
//对以上的linux.cfg文件编辑如果有错,将会导致nagios无法启动;
验证Nagios 配置文件
[root@nagios ~]# /usr/local/nagios/bin/nagios -v /usr/local/nagios/etc/nagios.cfg
5、重启
[root@nagios ~]#service nagios restart
[root@nagios ~]#service httpd restart
6、测试无法访问,检查一下IPtables是否关闭。
[root@nagios ~]# service iptables status
添加nrpe 5666端口:
[root@nagios ~]# vim /etc/sysconfig/iptables
-A INPUT -m state --state NEW -m tcp -p tcp --dport 5666 -j ACCEPT
[root@nagios ~]# service iptables restart
测试一下监控机使用check_nrpe与被监控机运行的nrpedaemon之间的通信.
[root@nagios ~]# /usr/local/nagios/libexec/check_nrpe -H 192.168.7.93 //被监控制端IP地址
NRPE v2.14
二、Linux被监控主机配置(IP:192.168.7.93)
1、增加用户
[root@web ~]# useradd nagios
[root@web ~]# passwd nagios
2、安装nagios插件
解压缩
[root@web ~]# tar -zxvf nagios-plugins-1.4.16.tar.gz
[root@web ~]# cd nagios-plugins-1.4.16
编译安装
[root@web nagios-plugins-1.4.16]# ./configure --with-nagios-user=nagios --with-nagios-group=nagios
[root@web nagios-plugins-1.4.16]# make;make install
这一步完成后会在/usr/local/nagios/下生成两个目录libexec和share
[root@web ~]# ls /usr/local/nagios/
include libexec share
改变目录权限使nagios用户能够访问
[root@web ~]# chown -R nagios.nagios /usr/local/nagios
[root@web ~]# chown -R nagios.nagios /usr/local/nagios/libexec
3、安装nrpe服务
解压缩
[root@web ~]# tar -zxvf nrpe-2.14.tar.gz
[root@web ~]# cd nrpe-2.14
编译
[root@web nrpe-2.14]#./configure
输出如下
*** Configuration summary for nrpe 2.8.1 05-10-2007 ***:
General Options:
-------------------------
NRPE port: 5666
NRPE user: nagios
NRPE group: nagios
Nagios user: nagios
Nagios group: nagios
Review the options above for accuracy. If they look okay,
type 'make all' to compile the NRPE daemon and client.
可以看到NRPE的端口是5666,下一步是make all
[root@web nrpe-2.14]# make all
输出如下
*** Compile finished ***
If the NRPE daemon and client compiled without any errors, you
can continue with the installation or upgrade process.
Read the PDF documentation (NRPE.pdf) for information on the next
steps you should take to complete the installation or upgrade.
接下来安装NPRE插件,daemon和示例配置文件
安装check_nrpe这个插件
[root@web nrpe-2.14]# make install-plugin
之前说过监控机需要安装check_nrpe这个插件,被监控机并不需要,我们在这里安装它是为了测试的目的
安装deamon
[root@web nrpe-2.14]# make install-daemon
安装配置文件
[root@web nrpe-2.14]# make install-daemon-config
现在再查看nagios目录就会发现有5个目录
[root@web nrpe-2.14]# ls /usr/local/nagios/
bin etc include libexec share
按照安装文档的说明,是将NRPE deamon作为xinetd下的一个服务运行的.在这样的情况下xinetd就必须要先安装好,不过一般系统已经默认装了
4、安装xinetd脚本
[root@web nrpe-2.14]# make install-xinetd
输出如下
/usr/bin/install -c -m 644 sample-config/nrpe.xinetd /etc/xinetd.d/nrpe
可以看到创建了这个文件/etc/xinetd.d/nrpe
编辑这个脚本
[root@web ~]# vim /etc/xinetd.d/nrpe
# default: on
# description: NRPE (Nagios Remote Plugin Executor)
service nrpe
{
flags = REUSE
socket_type = stream
port = 5666
wait = no
user = nagios
group = nagios
server = /usr/local/nagios/bin/nrpe
server_args = -c /usr/local/nagios/etc/nrpe.cfg --inetd
log_on_failure += USERID
disable = no
only_from = 127.0.0.1 //在后面增加监控主机的地址,例如:192.168.7.249
}
改后
only_from = 127.0.0.1,192.168.7.249
配置nrpe信息
[root@web ~]# vi /usr/local/nagios/etc/nrpe.cfg
81 allowed_hosts=127.0.0.1,192.168.7.249 //允许192.168.7.249服务器端对其监控
将219-223这5行注释掉,并在末尾添加如下命令:
command[check_ping]=/usr/local/nagios/libexec/check_ping -H 192.168.7.93 -w 3000.0,80% -c 5000.0,100% -p 5
command[check_users]=/usr/local/nagios/libexec/check_users -w 5 -c 10
command[check_load]=/usr/local/nagios/libexec/check_load -w 15,10,5 -c 30,25,20
command[check_disk_sda3]=/usr/local/nagios/libexec/check_disk -w 20% -c 10% -p /dev/sda3
command[check_zombie_procs]=/usr/local/nagios/libexec/check_procs -w 5 -c 10 -s Z
command[check_total_procs]=/usr/local/nagios/libexec/check_procs -w 150 -c 200
command[check_swap]=/usr/local/nagios/libexec/check_swap -w 20% -c 10%
command[check_http]=/usr/local/nagios/libexec/check_http -H 192.168.7.93
command[check_ssh]=/usr/local/nagios/libexec/check_ssh -H 192.168.7.93
command[check_mysql]=/usr/local/nagios/libexec/check_tcp -H 192.168.7.93 -p 3306
---------------------
注:这里客户端/usr/local/nagios/etc/nrpe.cfg内的command[check_mysql]与服务器端/usr/local/nagios/etc/object/services.cfg内的check_command check_nrpe!check_mysql
对应,services.cfg格式在服务器端/usr/local/nagios/etc/object/commands.cfg内有详解.
---------------------
5、启动NRPE
[root@web ~]# /usr/local/nagios/bin/nrpe -c /usr/local/nagios/etc/nrpe.cfg -d
重启服务可用lsof -i:5666 查看PID,并kill -9 "PID",而后重复上述启动命令.
//检测nrep配置文件的正确性
#netstat -an | grep 5666 //是否监听5666用于nrpe通信的端口
6、测试无法访问,检查一下IPtables是否关闭。
[root@web ~]# service iptables status
添加nrpe 5666端口:
[root@web ~]# vim /etc/sysconfig/iptables
-A INPUT -m state --state NEW -m tcp -p tcp --dport 5666 -j ACCEPT
[root@web ~]# service iptables restart
7、在服务端监控端执行检测工作站nrpe信息
[root@nagios ~]# /usr/local/nagios/libexec/check_nrpe -H 192.168.7.93
NRPE v2.14
8、查看nrpe进程
[root@localhost ~]# ps -elf |grep nrpe
[root@web ~]# ps -elf |grep nrpe
5 S nagios 1480 1 0 80 0 - 9708 poll_s Mar14 ? 00:00:00 /usr/local/nagios/bin/nrpe -c /usr/local/nagios/etc/nrpe.cfg -d
0 S root 1611 1437 0 80 0 - 25809 pipe_w 00:40 pts/0 00:00:00 grep nrpe
9、登录到WEB界面
修改密码:
htpasswd -c /usr/local/nagios/htpasswd.users nagiosadmin
输入密码123456
输入用户名密码:
nagiosadmin 123456
点击Services:
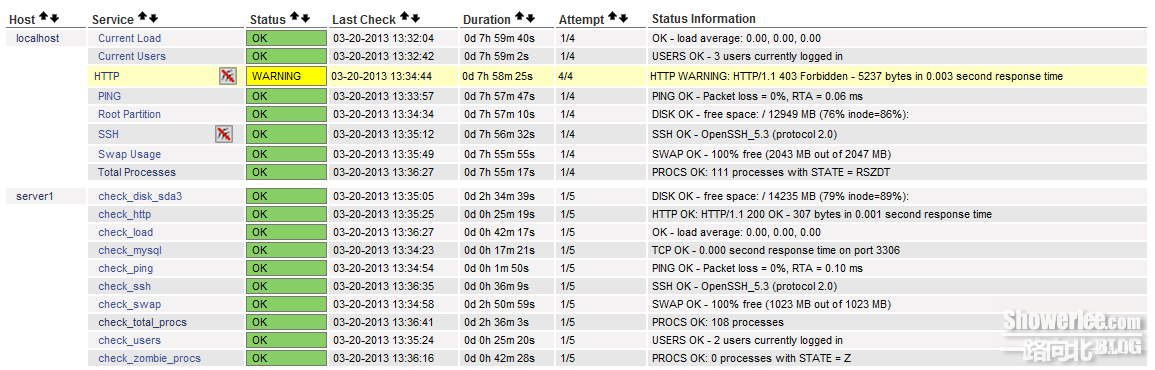
至此大功告成...
注: nrpe 提示Connection refused by host
在centos6.3 x64上安装nagios的nrpe服务,当nrpe顺利安装完成之后,执行/usr/local/nagios/libexec/check_nrpe -H localhost,提示Connection refused by host
解决方法:
启动NRPE
[root@web ~]# /usr/local/nagios/bin/nrpe -c /usr/local/nagios/etc/nrpe.cfg -d
然后执行,netstat -an | grep 5666
显示:tcp 0 0 127.0.0.1:5666 0.0.0.0:* LISTEN
则启动成功。
然后再执行:/usr/local/nagios/libexec/check_nrpe -H localhost
返回:NRPE v2.14
进阶:
----监控内存----
【客户端】
1、添加脚本:
vi check_mem.sh
-----------------
TOTAL=`free -m | head -2 |tail -1 |gawk '{print $2}'`
# Free memory
FREE=`free -m | head -2 |tail -1 |gawk '{print $4}'`
# to calculate free percent
# use the expression free * 100 / total
FREETMP=`expr $FREE \* 100`
PERCENT=`expr $FREETMP / $TOTAL`
echo "$FREE MB ($PERCENT%) Free Memory"
exit 0
-------------------------
并且把该脚本复制到/usr/local/nagios/libexec,赋予执行权限,属主改为nagios
#cp check_mem.sh /usr/local/nagios/libexec
#chmod u+x check_mem.sh
#chown nagios check_mem.sh
2、修改配置文件:
vi /usr/local/nagios/etc/nrpe.cfg
添加:
command[check_mem]=/usr/local/nagios/libexec/check_mem.sh -w 150 -c 100
3、在客户端测试脚本,
# ./check_mem.sh
200 MB (1%) Free Memory
4.重启服务
[root@server1 libexec]# lsof -i:5666
COMMAND PID USER FD TYPE DEVICE SIZE/OFF NODE NAME
nrpe 4457 nagios 4u IPv4 485359 0t0 TCP *:5666 (LISTEN)
[root@server1 libexec]# kill -9 4457
[root@server1 libexec]# /usr/local/nagios/bin/nrpe -c /usr/local/nagios/etc/nrpe.cfg -d
【服务器端】
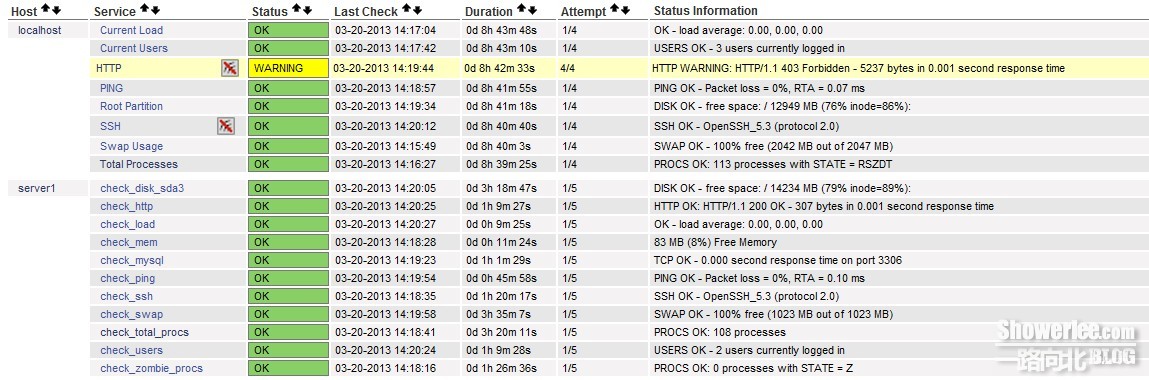
1.添加监控模块:
vi /usr/local/nagios/etc/object/services.cfg
添加:
--------
define service{
host_name server1
service_description check_mem
check_command check_nrpe!check_mem
max_check_attempts 5
normal_check_interval 3
retry_check_interval 2
check_period 24x7
notification_interval 10
notification_period 24x7
notification_options w,u,c,r
}
---------
2.重启服务
service nagios restart
3.访问http://192.168.7.249/nagios/
如图
正文部分到此结束
版权声明:除非注明,本文由(showerlee)原创,转载请保留文章出处!
本文链接:http://www.showerlee.com/archives/606
本文链接:http://www.showerlee.com/archives/606
继续浏览:NAGIOS


还没有评论,快来抢沙发!